Appeals Court Rules in Favor of Private Schools
4th Circuit overturns lower court decision that threatened private schools with potentially crushing costs of complying with federal regulations.
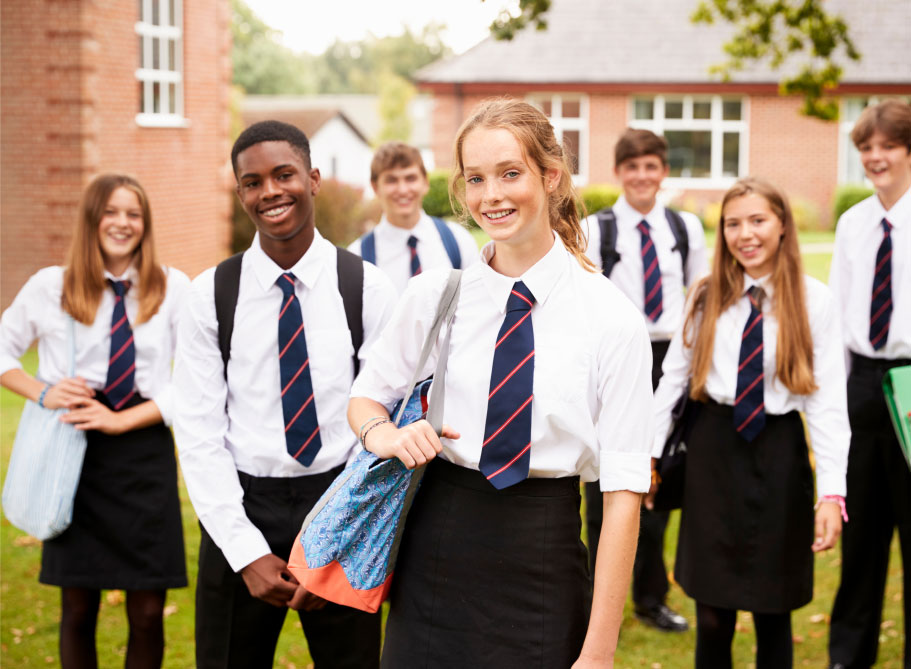


There are over 30,000 private schools in America. In fact, approximately one in four of the nation’s schools is a private school. More than 4.6 million students (nearly 10 percent of all students) attend them. CAPE member organizations represent about 80 percent of private school enrollment nationwide.
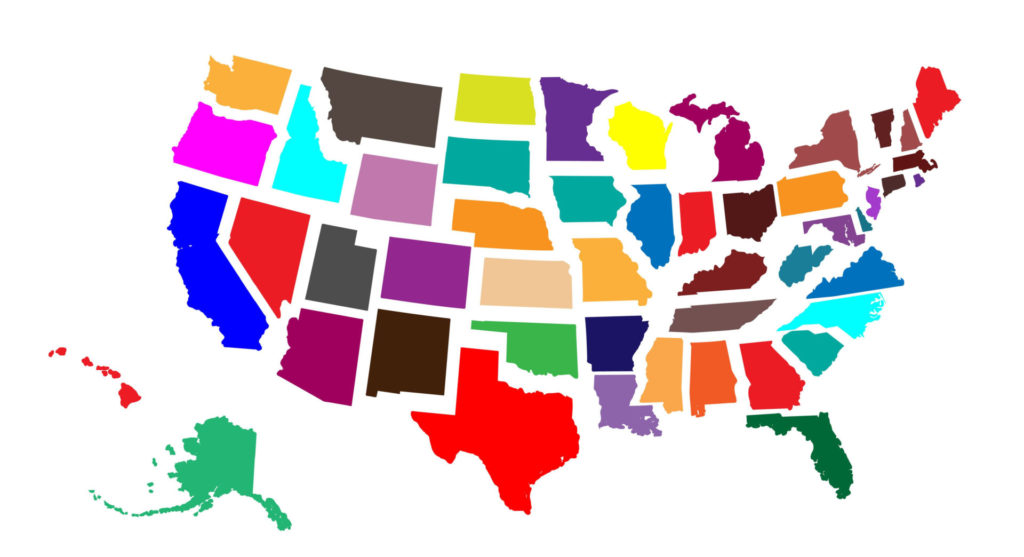
Because most issues and activities pertaining to private schools begin or manifest themselves in the states and territories, the State CAPE Network plays a unique and critical role in helping identify, define, and clarify issues affecting private education.

The National Blue Ribbon Schools Program celebrates excellence in education since 1982. Explore the list of schools who made the list and learn more about the application process.
CAPE’s mission is to preserve and promote educational pluralism so that parents have a choice in the schooling of their children. Founded in 1971 to provide a coherent voice for private education, CAPE is dedicated to fostering communication and cooperation within the private school community and with the public sector to improve the quality of education for all of the nation’s children.

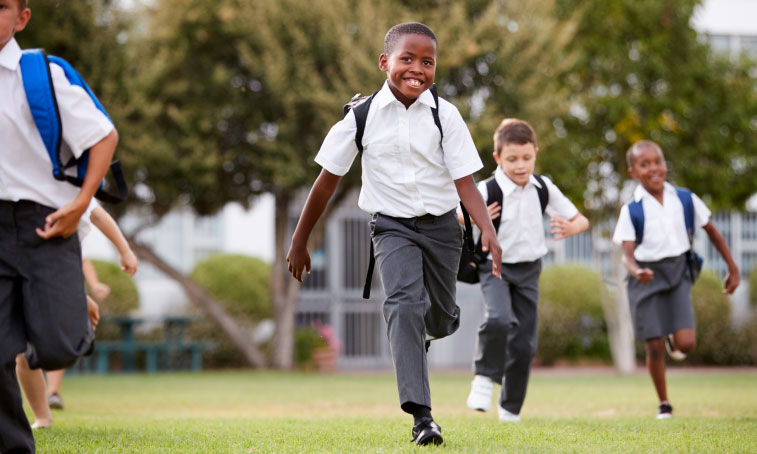
Locate a private school in your area with the national center for education statistics.